Your Performance Dashboard Is Lying to You: The Metrics That Actually Predict Organizational Success
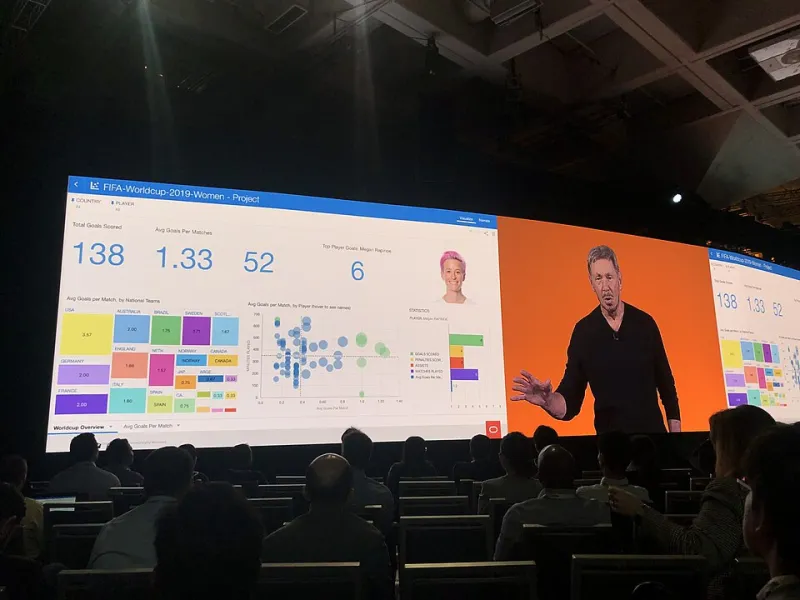
Photo: GeneralAB13, CC BY-SA 4.0, via Wikimedia Commons
Let us be direct about something that many consultants and software vendors prefer to leave unexamined: a significant portion of what fills the average corporate performance dashboard is noise.
Not malicious noise. Not intentional misdirection. But noise nonetheless—numbers that are easy to generate, visually satisfying to display, and almost entirely disconnected from the outcomes that determine whether an organization thrives or stagnates.
This is not a technology problem. The proliferation of business intelligence platforms, data warehouses, and real-time analytics tools has made it easier than ever to measure almost anything. The difficulty lies in deciding what deserves to be measured—and having the organizational discipline to stop tracking what does not.
At Ingaab Consulting, we engage regularly with leadership teams across industries who have invested substantially in performance measurement infrastructure. What we find, with striking consistency, is that organizations are drowning in data while starving for insight. The dashboards are full. The decisions remain difficult.
The culprit, more often than not, is an over-reliance on lagging indicators—metrics that confirm what already happened rather than illuminate what is about to happen—combined with a cultural preference for metrics that reflect well on the teams reporting them.
The following framework challenges that convention. These are the five categories of performance metrics that, based on organizational research and practitioner experience, most reliably predict sustainable success.
1. Employee Activation Rate, Not Headcount or Satisfaction Scores
HR dashboards across corporate America are populated with employee satisfaction scores, turnover rates, and headcount figures. Each of these has its place. None of them, in isolation, tells you whether your workforce is actually contributing to organizational performance.
Employee activation—a concept distinct from both satisfaction and engagement—measures the degree to which employees understand the organization's strategic priorities, believe their work contributes to those priorities, and feel equipped to act on that understanding. Research from Gallup and the O.C. Tanner Institute consistently finds that activation, rather than general satisfaction, is the strongest workforce predictor of productivity, innovation output, and voluntary retention.
An employee can be satisfied with their compensation and work environment while remaining entirely passive in their contribution to organizational goals. Activation measures the gap between potential and realized contribution—which is precisely the gap that performance-focused leaders should be working to close.
What to measure instead: Percentage of employees who can accurately articulate organizational priorities; correlation between role clarity scores and output quality; internal mobility rates as a proxy for activated talent development.
2. Decision Velocity, Not Meeting Volume or Approval Cycles
Organizational efficiency is frequently measured in terms of process compliance—are approvals being completed on schedule, are meetings being held as planned, are workflows being followed? These are lagging indicators of process adherence, not leading indicators of organizational agility.
Decision velocity measures how quickly an organization moves from problem identification to committed action. It is one of the most powerful predictors of competitive performance, particularly in industries where market conditions shift rapidly. A 2021 analysis by Bain & Company found that companies in the top quartile for decision effectiveness generated returns approximately 6 percent higher than average—a premium attributable not to smarter individual decisions, but to faster, more consistently executed decision-making processes.
Slowing decision velocity is often the first visible symptom of structural dysfunction—whether caused by unclear accountability, excessive hierarchy, risk-averse culture, or misaligned incentives. Tracking it as a primary metric surfaces these dysfunctions before they become crises.
What to measure instead: Average time from issue identification to decision commitment by decision type; percentage of decisions made at the appropriate organizational level; reversal rate of decisions (a high rate signals poor initial decision quality).
3. Customer Effort Score, Not Net Promoter Score Alone
Net Promoter Score has become one of the most widely adopted customer metrics in the United States, and for understandable reasons—it is simple, benchmarkable, and correlates reasonably well with growth in certain industries. It has also, in many organizations, become a vanity metric: tracked religiously, reported enthusiastically, and acted upon inconsistently.
The deeper problem with NPS as a standalone metric is that it measures sentiment after the fact. It tells you how customers felt about an experience; it does not reliably predict whether they will change their behavior as a result. Customer Effort Score, by contrast, measures the friction customers encounter in achieving their goals when interacting with your organization. Research from the Corporate Executive Board—now part of Gartner—found that reducing customer effort is a stronger predictor of loyalty and repeat purchase behavior than delighting customers through exceptional service.
For organizations competing in markets where switching costs are moderate to low, effort reduction is a more actionable and more predictive metric than sentiment elevation.
What to measure instead: Customer Effort Score by interaction type and channel; issue resolution rate on first contact; self-service completion rates as an indicator of experience design quality.
4. Strategic Initiative Progress Rate, Not Budget Utilization
Finance departments and executive teams frequently monitor budget utilization as a proxy for organizational execution. The logic is intuitive: if resources are being deployed as planned, the organization must be performing as intended.
This logic fails in practice for a straightforward reason. Budget utilization measures spending, not outcomes. An organization can consume its entire strategic investment budget while making no meaningful progress toward its stated objectives—and frequently does.
Strategic initiative progress rate measures whether the organization's most consequential projects are advancing toward defined milestones at the pace required to achieve strategic goals. It requires clear milestone definition, honest status reporting, and a leadership culture willing to distinguish between activity and progress—a distinction many organizations find genuinely uncomfortable.
High-performing organizations treat initiative progress as a board-level visibility item, not merely an operational concern. When strategic investments are not generating forward movement, they require either resource reallocation or objective recalibration. Neither response is possible when the dashboard reports budget utilization rather than outcome proximity.
What to measure instead: Percentage of strategic initiatives on track against milestone commitments; time-to-impact for major investments; initiative abandonment rate (a healthy rate signals disciplined resource reallocation, not failure).
5. Organizational Learning Velocity, Not Training Hours Completed
Learning and development functions in US organizations are commonly measured by training hours completed, course completion rates, and certification attainment. These are activity metrics. They confirm that learning events occurred. They do not confirm that organizational capability improved as a result.
Organizational learning velocity measures the rate at which new knowledge, skills, and practices are actually adopted into operational behavior. It distinguishes between organizations that expose employees to new capabilities and organizations that integrate those capabilities into how work gets done.
In an environment where technological change is accelerating and competitive advantage increasingly depends on adaptability, the ability to learn and apply new capabilities faster than competitors is itself a strategic differentiator. Organizations that measure learning by activity rather than adoption systematically underestimate their own capability gaps.
What to measure instead: Time from training completion to observable behavior change; percentage of trained employees applying new skills in core workflows within 90 days; performance delta between trained and untrained cohorts on relevant output metrics.
Rebuilding Your Dashboard Around What Matters
None of these metrics are simple to implement. Each requires deliberate measurement design, honest data collection, and a leadership culture willing to act on what the numbers reveal—including when the revelation is unflattering.
That discomfort is, in a sense, the point. Vanity metrics persist not because organizations are unsophisticated, but because they are human. Metrics that consistently reflect well on the teams reporting them tend to survive regardless of their predictive value. Metrics that surface difficult truths tend to be questioned, redefined, or quietly deprioritized.
Building a performance measurement system that genuinely empowers organizational improvement requires making a deliberate choice to prioritize predictive value over presentational comfort. It requires asking not "what can we easily measure?" but "what, if we measured it honestly, would tell us something we need to know?"
At Ingaab Consulting, that question sits at the center of every performance management engagement we undertake. The organizations that answer it rigorously—and rebuild their dashboards accordingly—do not merely gain better data. They gain a fundamentally more accurate understanding of where they stand and what it will take to perform at their best.